We all know representation of any research data adds credibility to your post. Now the question is how to represent this data in our post? Listing the figures and facts in the post is quite boring for users. So, a better way to represent this kind of data is in visual formats like graphs and charts.
This is a fallacy that charts/graphs are very difficult to create on website. There are numerous plugins available for WordPress that helps you to create charts and graphs. In this article we’ll show how to easily create charts and graphs in your WordPress website.
Visualizer is one of my favorite plugins that enables you to create interactive charts and graphs in WordPress posts or pages. The plugin provides you 9 varieties of chart like line chart, area chart, bar chart etc.

Some of the important features of Visualizer plugin are:
- Create beautiful and colour coded map of the world.
- The plugin uses Google visualization API that ensures your graph can be displayed properly.
- No need to insert complex shortcodes into your post or pages.
- Allows you to upload CSV file and create a graph form this data.
How to add charts/graphs using Visualizer plugin?
First, you need to install and activate the Visualizer plugin. After installing and activating the plugin create a new post or you can also edit the existing one.
Now click on Add media button on the post edit screen. You’ll see one more item is added to your media uploader for Visualization like below screenshot:
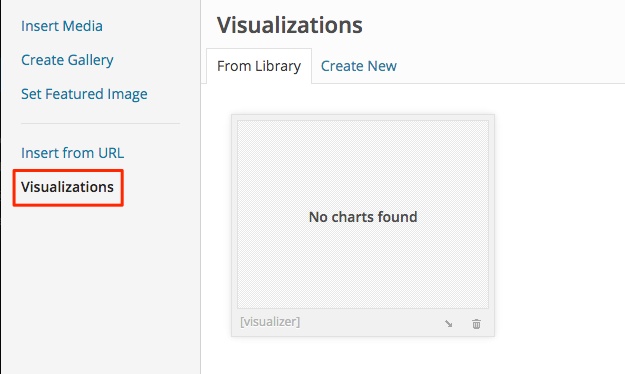
When you click on Visualizations option, you’ll see the Visualization library. Since you install this plugin for the first time, no charts or graph is present in your Visualization library. Now click on Create New option to create a new graph.
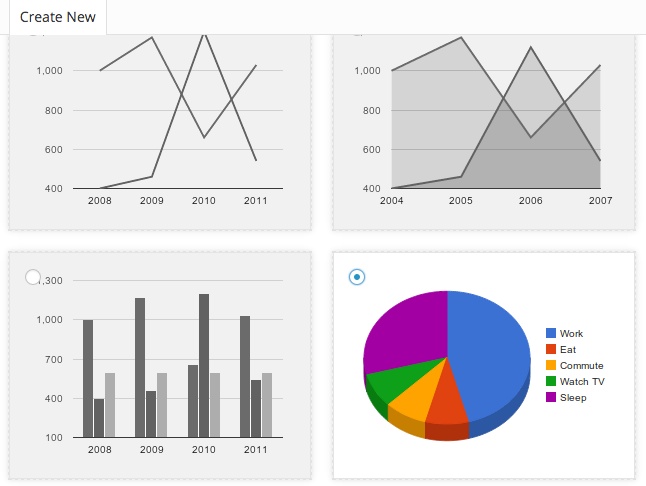
Once you have clicked Create New option, you’ll see 9 different types of charts and graphs. You can select any chart you want to add in your post/page. To select the chart simply hover the mouse on the chart you want to add and click on the radio button on the top left of the hovered chart like below screenshot:
Now click on the Next button on the bottom right corner of the screen. Once you clicked on this option you’ll reach to upload CSV file page. In this page you’ll see two option: upload CSV file from computer or upload CSV file from web.
Adding Chart by uploading CSV file from Computer
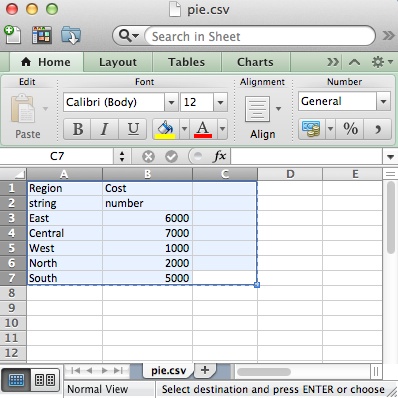
In this option, you just need to upload a CSV file from your computer. If you’re creating CSV from excel then save file from .csv extension. Excel will automatically separate data with commas. If you are using other editor then simply write the data separated by comma and save it from .csv extension.
Below is an example of CSV file that I created in Excel:
Once you uploaded a CSV file by clicking on From Computer button, you will see the result like below screenshot:
Now click on Next button. You’ll reach to a next screen where you’ll see a menu on the right hand side. With this menu you can change the settings of your chart, change the styling, layout and colour, change it to 3D option etc. Once you satisfied with the chart, click on Insert Chart button.
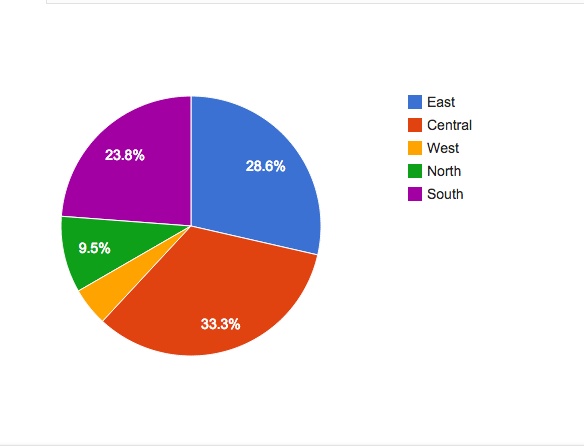
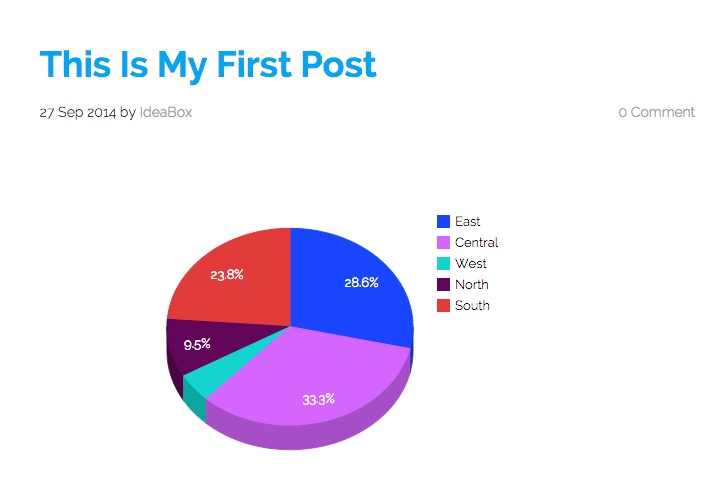
Once you clicked on Insert Chart button, you’ll see a shortcode of your chart in your post. Now click on Save draft button to save your post or click on Publish button. After clicking on Publish button you’ll see the final result like below screenshot:
 We hope this article helped you in successfully adding a chart or graph in your WordPress website. For queries, you can leave a comment in comment section below.
Checkout our amazing, easy to use WordPress themes.